The HUD
By Ian Provencher
On my subscription plan, Claude’s usage service reports three windows: a 5-hour window, a 7-day window, and a weekly window scoped to one model. That plan is Ultra, and Anthropic removes the 5-hour window once it verifies the account; the strip draws a window only while the service reports one. Each fills as you work and resets on its own clock. The HUD is the strip I keep above the prompt to see all three, plus the prompt cache and the context, without asking.
The part worth explaining is the grading. A bar that turns amber once most of a window is gone says nothing useful on day six of seven, and it says too little on the first morning. So nothing on the strip is graded on how much is gone. Each window is graded on where it will land at its reset, and the week is graded against a plan that is deliberately front-loaded.
The other two posts in this series cover the planning half, Plan mode, enforced, and the proof half, The completion meter. The workflow post traces one job through all of it.

-
01 What the strip shows
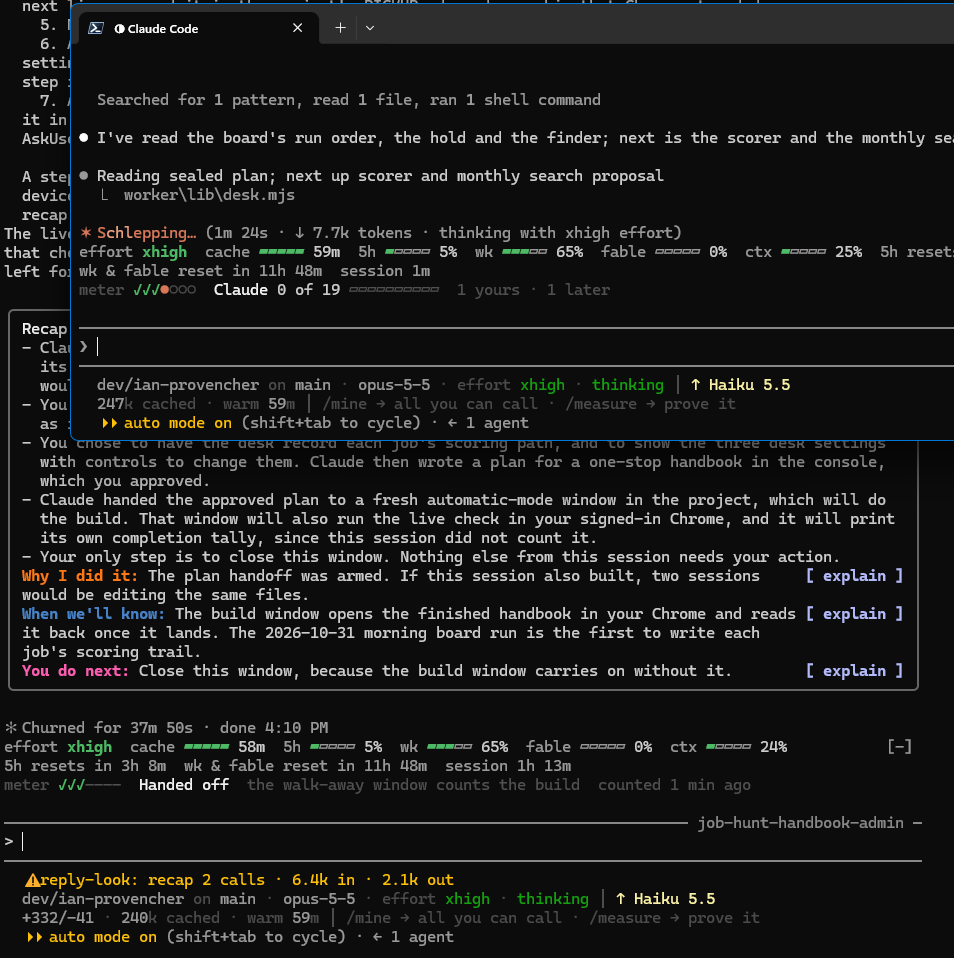
A modOne line above the prompt, in every terminal: the cache, three usage windows and the context, each as five cells and a figure.
effort level · cache ▰▰▰▰▰ 59m · 5h ▰▱▱▱▱ 2% · wk ▱▱▱▱▱ 0%fable ▱▱▱▱▱ 0% · ctx ▰▰▱▱▱ 39% · 5h resets in 4h 18m · wk & fable reset in 6d 19hThe story's panel is that line as it read during this build. The effort chip comes first, then the gauges in a fixed order: cache, 5-hour, week, the model-scoped window, context. Then the resets, grouped when two windows reset together, and how long the session has run. When something needs attention, its alarm leads the line in its band's colour.
Five cells is coarse on purpose. Any reading above zero lights at least one cell, so a window that has started is never drawn empty. The figure beside the cells is the exact reading, and the colour is the grade, which is the part the rest of this story is about.
-
02 A mod, not a status line
A modThe status line carries the session. The HUD carries the account and the clock.
status line · folder · branch · model · effortHUD strip · cache · limits · context · resets · session clockThat split is a decision from 11 October. A status line is a script Claude Code runs and prints, so it can show text and nothing else. A mod is code Claude Code loads into its own engine. This one draws the effort chip as a real button, opens a full panel on
/hud, and hooks two engine events a script never sees: each request going out, and each measurement of the session.In VS Code the strip hides itself by default, because the same readings are already in a sidebar there. The effort chip stays, so the band above the prompt always draws.
-
03 Where each number comes from
A fileThree sources, and the strip trusts each one for different numbers.
$.session.usage()                    context, and this session's 5-hour and weekly readings
statusline-stats/usage-latest.json   the account's usage reading, shared with the sidebar;
                                     the only source of the model (Fable) window
statusline-stats/session-stdin-<id>  the status line's capture: the prompt cache, the model,
                                     effort, and the session's running time
The engine's own usage call answers for this session. The account-wide reading comes from Claude's usage service, which reports the 5-hour window, the 7-day window and a weekly window scoped to one model, each with its reset time. That reading lives in one shared file, so the sidebar and every terminal read the same numbers. When the session's figure and the shared one disagree, the strip keeps the highest reading for the newest reset, because a window can only fill until it resets.
The status line's capture supplies what only Claude Code knows about this conversation: how long its prompt cache lives and when the current one expires.
-
04 The cache countdown
The ruleThe cache countdown is the time until the next request pays full price to re-read the conversation.
export function cacheExpiry(anchorMs, ttl, capExp) {
  let exp = anchorMs != null ? Math.round(anchorMs / 1000) + ttl : null
  if (capExp != null && (exp == null || capExp >= exp)) exp = capExp
  ...
}
Each request writes the conversation into a cache, and a request within its lifetime reads it back at a fraction of the cost. The anchor is the moment the main conversation's last request went out, noted on the engine's request event. Expiry is that moment plus the cache's lifetime, or Claude Code's own expiry figure when that is later. A helper's request does not move it, because a helper keeps a cache of its own.
The strip shows whole minutes, rounded down. The alarm says "cache cold in" a number of minutes rounded up, so it never claims more time than is left.
-
05 Grade a landing, not a level
The mathA level says how much is gone. A landing says where the window ends up at its reset, and only the landing is graded.
export const PRESSURE_WARN = 100;
export const PRESSURE_BAD = (100 * WEEKEND_CEILING) / WEEKEND_SAFE;
export const LANDING_BAND = [PRESSURE_WARN, PRESSURE_BAD];
export const bandOf = (v, [warn, bad]) => (v >= bad ? "bad" : v >= warn ? "warn" : "ok");
Green runs all the way to the whole allowance, because allowance left unused at the reset is waste. Amber starts at a landing of 100%. Red starts at 128.6%, a figure that is derived rather than typed: it is the weekend's ceiling divided by the weekend's plan, so the weekly bar and the weekend card turn red at exactly the same reading.
The comment above the constant: "A rounded 130 would let the two cards disagree across pct 45.0..45.5." One band serves every limit window, a decision from 25 September.
-
06 The week has a shape
The mathThe week is planned front-loaded, and a week is graded against that plan, not against the clock.
Percent of the weekly allowance. The line is the plan; the dots are this build's readings, each with a line to where it lands at the reset. The amber band starts at the whole allowance, and red starts where the weekend's ceiling maps. The readings as a table
Reading Time (ET) Used Plan by then Lands at build-start 08:01 0% 2.9% 0% after-S5 08:29 1% 3.3% 2.9% after-S8 08:52 2% 3.6% 5.7% after-S6 09:00 2% 3.6% 5.7% after-S7 09:13 2% 3.8% 5.7% The weekend's two days are planned to take 35% of the week's allowance, and the five weekdays split the rest evenly. So the plan reaches 35% when the weekend closes and 100% at the reset, with a corner where the two meet. The landing is the share of the plan spent so far, carried to the end: at 74% of what the plan expects by now, the week lands at 74%.
export function weekPlanLanding(pct, elapsedFrac, share) {
  ...
  const denom = weekBudget(Math.max(Number(elapsedFrac) || 0, WEEKEND_FRAC), share);
  return denom > 0 ? (100 * p) / denom : null;
}
Two choices in those lines are measured ones. Dividing by clock time instead of the plan "projects a 122% overrun for a weekend spent exactly to plan", because the plan front-loads. And elapsed time is floored at the weekend's close, "so three hours of Saturday cannot project 137%". At the floor the plan already reads the weekend's share, so the landing does not jump when the floor stops applying.
-
07 Low fuel is a second landing
The mathThe plan arm is an average. A second landing catches a burst, and the worse of the two wins.
const recent = p + r * Math.min(h, RECENT_HORIZON_HOURS)
return recent == null ? l : Math.max(l, recent)
The second landing is today's level plus the recent burn rate, carried forward at most five hours. Both are on the same scale, a percent of the allowance at the reset, so "the worse reading wins" is a plain maximum. The rate is fitted over the last hour for the 5-hour window and the last three for the week, and it needs at least ten minutes of rising readings before it counts.
An idle window has no recent rate, and then the plan figure stands alone. Reading idle as a rate of zero would grade an idle session better than a working one.
-
08 Five hours and the Fable window
The mathThe 5-hour window and the model window have no plan, so their landing is the plain projection.
landing = used + average rate × time leftbelow a tenth of the window · too early to projectbeside it · the recent-rate landing, the worse one winsA reading arrives as a whole percent. Five percent of the way into a window, half a point of rounding moves the projection by ten points either way. So for the first tenth of a window no landing is formed, and the level itself is graded on the same band. The level is never above the landing, so that can only under-warn.
On these two windows a landing past 100% means requests refused before the reset. The amber stretch up to 128.6% is deliberate: the same band everywhere, read the same way.
-
09 Context
The ruleContext is graded on its level, against a band from half full to seven tenths full.
export const CONTEXT_BAND = [50, 70];
{ ok: "Plenty of room", warn: "Clear at the next natural break", bad: "Clear now" }
Context fill is the conversation's size against the model's window. It has no reset to land at, so its level is the grade. The three verdicts are instructions rather than descriptions, because the only action context fill ever calls for is clearing or compacting the conversation.
-
10 The effort chip
A modThe first thing on the line is the effort level, and pressing it opens Claude Code's own picker.
export const effortFromReply = (text) =>
  /Set effort level to ([a-z]+)\b/i.exec(text ?? '')?.[1]?.toLowerCase() ?? null
The chip is a button that runs
/effort, and Alt+E opens the same picker from the prompt. The level shown comes from the status line's capture, or from the picker's own reply the moment it is answered. The time of the last reply is kept, so a capture written before it cannot put the old level back. -
11 Refreshed by events
A modReadings refresh on a minute timer, after every answer, and when the engine measures the session.
$.clock.every(60_000, () => { void refreshNow($); ... })
on('turn.step', ...)        // after each main response: refreshSoon($)
on('session.measure', ...)  // refreshSoon($)
The account reading is the expensive one. Claude's usage service rate-limits, and a 429 arrived with only two callers, so every display shares one slot: the shared file's modification time. A display fetches only when the file is older than five minutes, and it touches the file before fetching, which claims the slot for everyone else.
One fast timer does run, every five seconds, and it only lists the helpers and shells still running. It never refreshes a reading.
-
12 One core, six copies
A fileThe grading math lives in one module, and a check refuses a copy that drifts from it.
vscode-hud/hud-core.mjs · the source, loaded by the VS Code sidebarmods/hud-strip · grades with itfour other mods · its clock and text helpers onlya sync script copies it · a guard compares every copy identicalClaude Code loads each mod from its own folder, so a mod cannot import a file outside it. The module is therefore copied into each mod that uses it, six copies in all. A sync script writes the copies. A guard compares each one to the source and refuses any commit to the setup that touches them while one differs. Its control plants a changed band constant in a copy and must see the difference.
Only two of the six grade anything: the sidebar and this strip. That is the property that matters. They run the same file, so they cannot disagree about a colour.
-
13 Measured on this build
MeasuredEvery reading on this page was taken during the build that wrote it, and graded by the module itself.
- build-start, 08:01 ET. 5-hour 2% → lands 18.4%; week 0%, landing 0%; context 39%.
- after-S5, 08:29 ET. 5-hour 3% → lands 14.5%; week 1%, landing 2.9%; context 25%.
- after-S8, 08:52 ET. 5-hour 5% → lands 16%; week 2%, landing 5.7%; context 38%.
- after-S6, 09:00 ET. 5-hour 5% → lands 15.3%; week 2%, landing 5.7%; context 42%.
- after-S7, 09:13 ET. 5-hour 6% → lands 16%; week 2%, landing 5.7%; context 16%.
Only named fields were kept from each reading: the three windows' percents and resets, the cache's expiry and the context fill. The script that took them hands each one to the HUD's own grading functions rather than a copy of the math, so a figure here is the figure the strip drew.
In action
What it does not do
It does not know my plan’s allowance in tokens. Every figure is a percent of a window, as Claude’s usage service reports it, and that is all it needs: the grade is about the shape of spending inside a window, not its size.
It does not predict a burst. The recent-rate landing reacts to one once it has ten minutes of rising readings, and the plan landing never reacts to one at all. The strip tells me where I am heading, and the decision to slow down stays mine.
It does not hide its own faults. When the usage reading fails, the strip adds the error to the line, and a window whose reading has gone stale shows a question mark rather than its last figure.
Where the code lives
The strip and its core live in my private setup repository, so this post quotes them rather than linking them. The strip has its own test suite. The core is also the VS Code sidebar’s, and the sidebar’s installer runs eleven suites before it installs anything, two of them built to drive the moments live data rarely shows: a closed weekend, and the instant the weekend closes.